Charting
Brexit
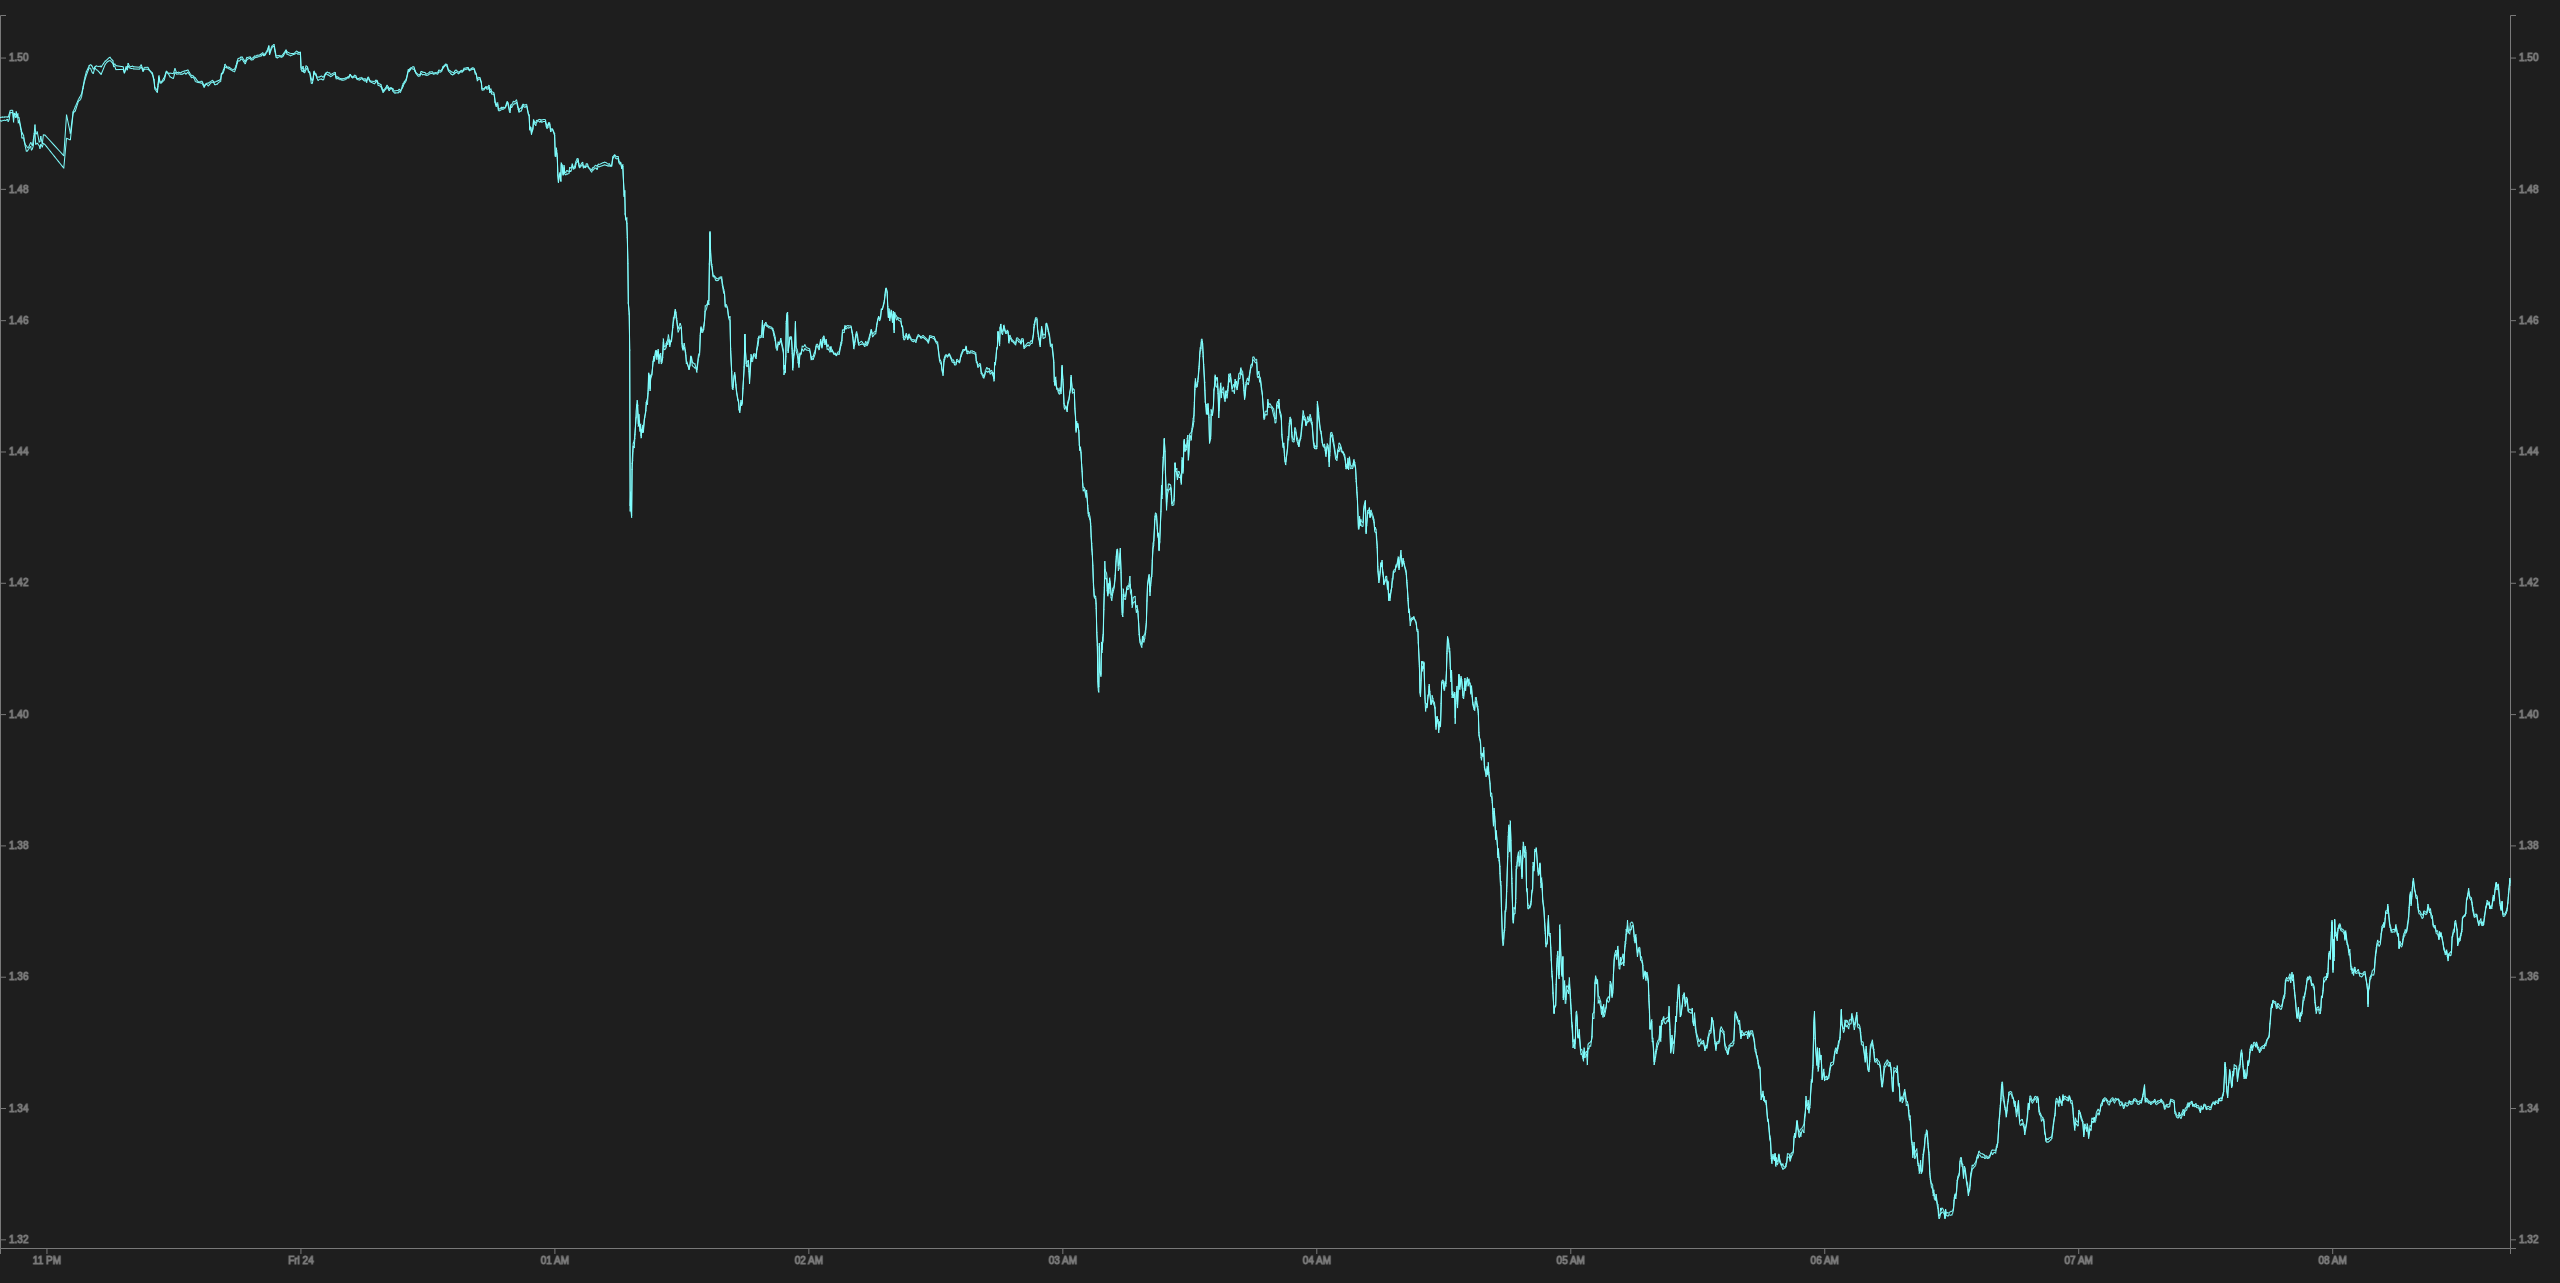
2016-06-24 Price drop from ~1.50 - ~1.32
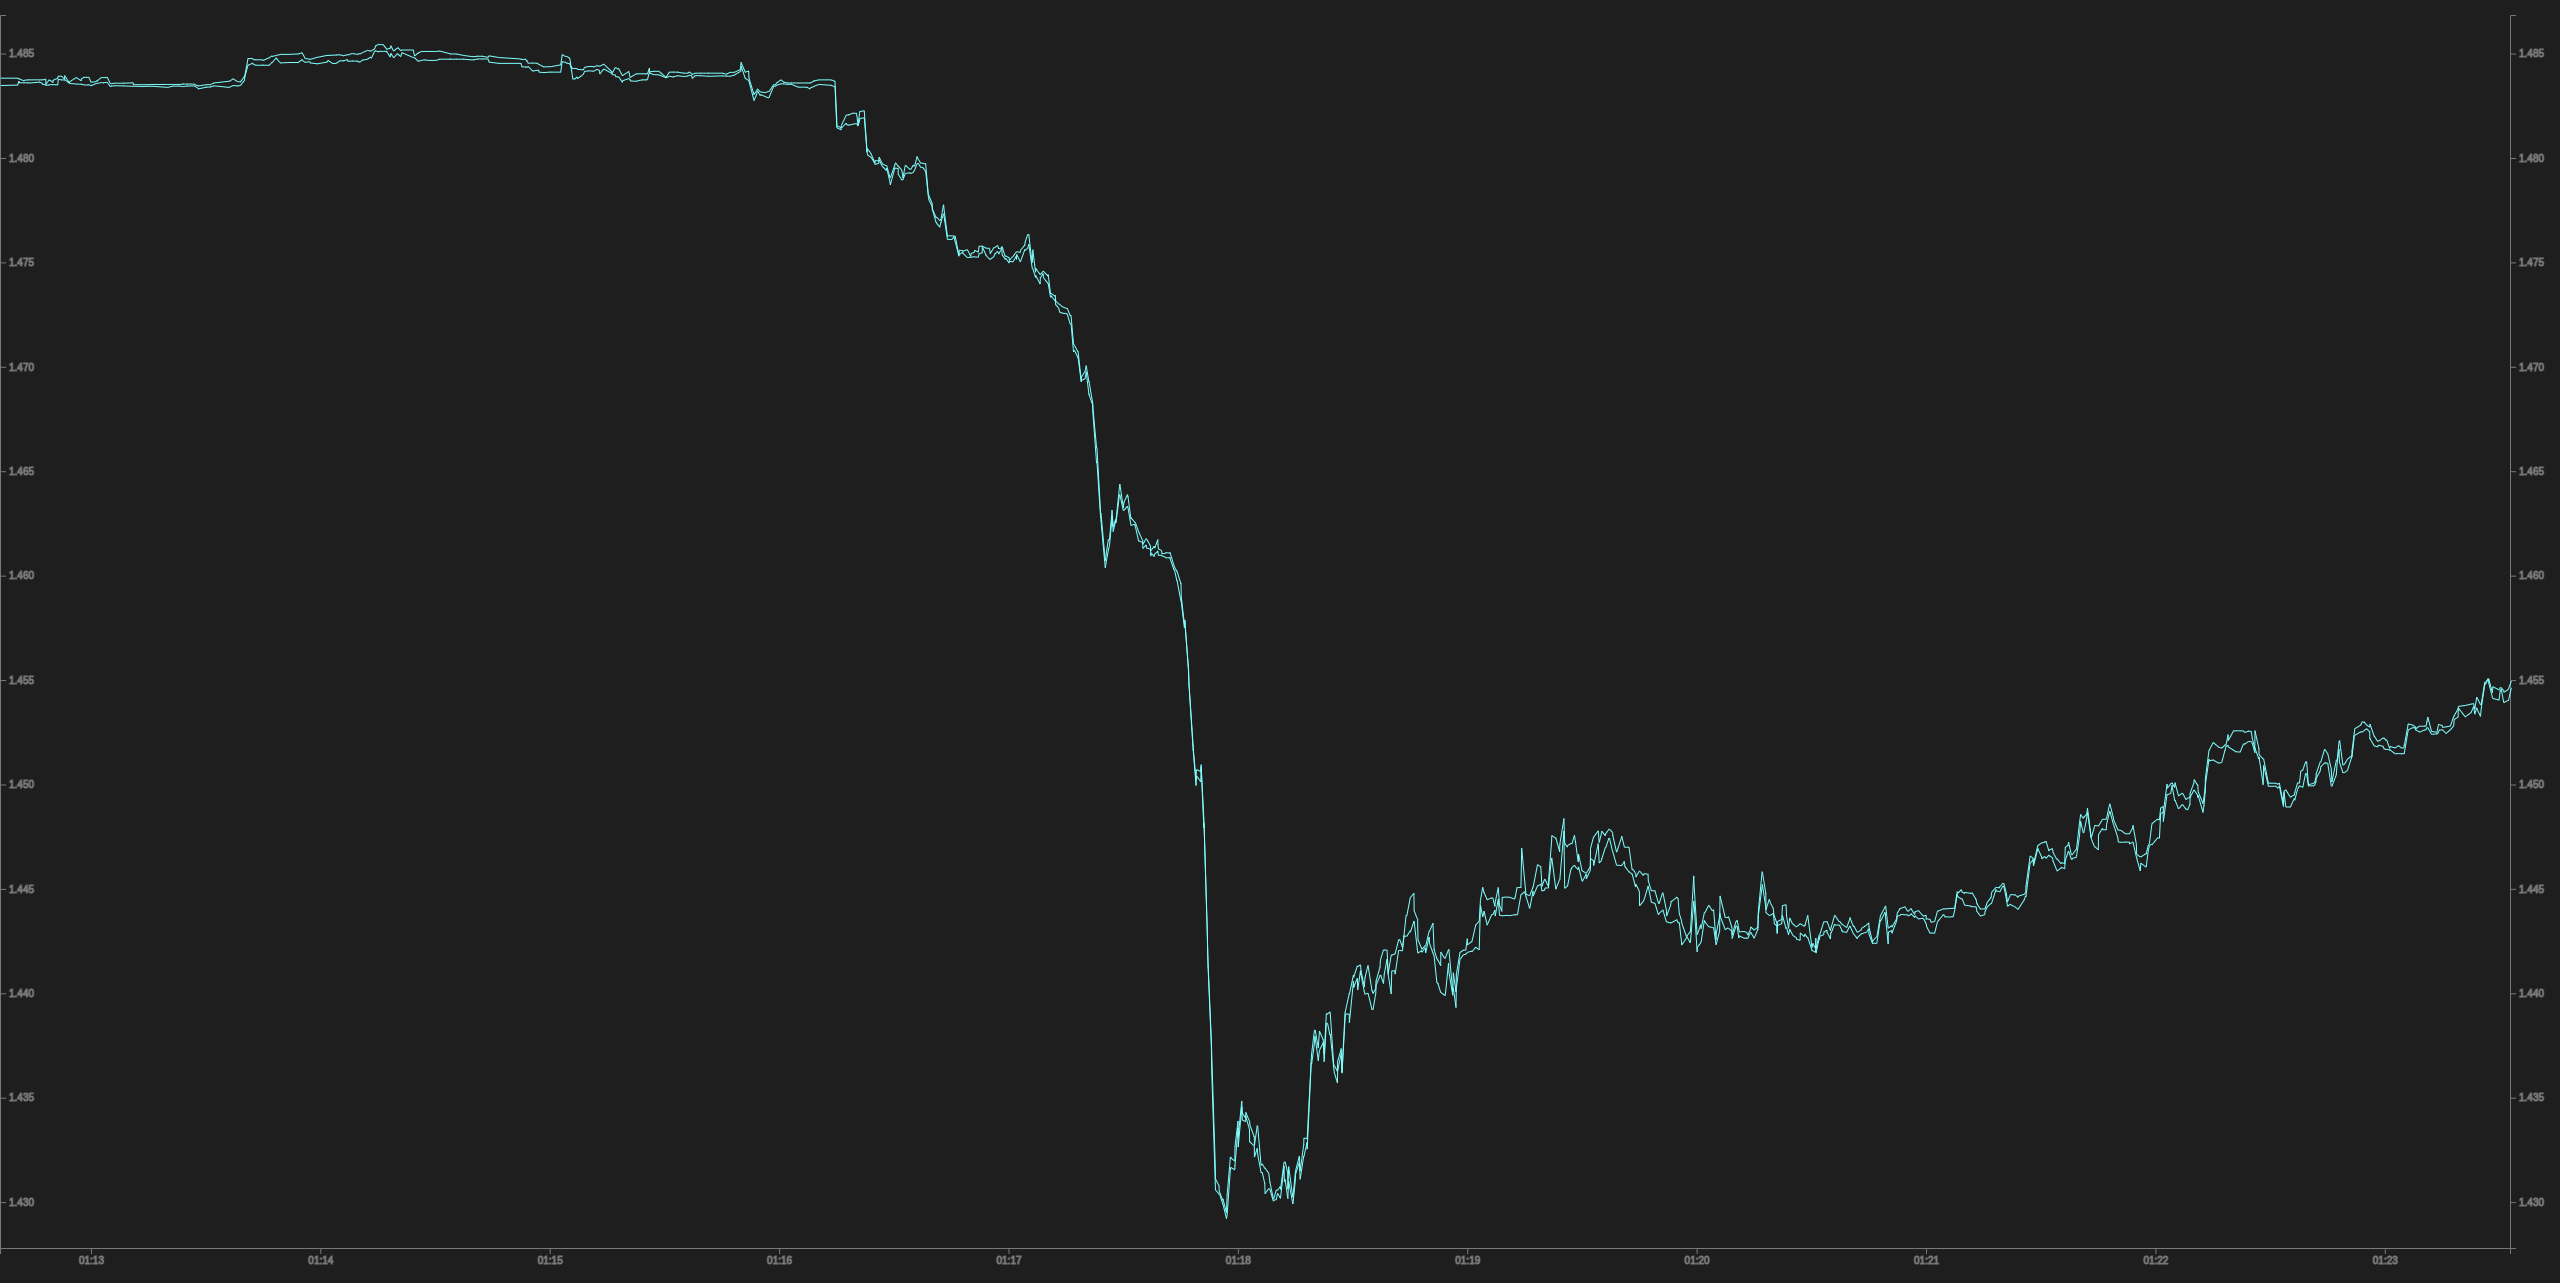
Detail of the first drop (~10 minutes range)
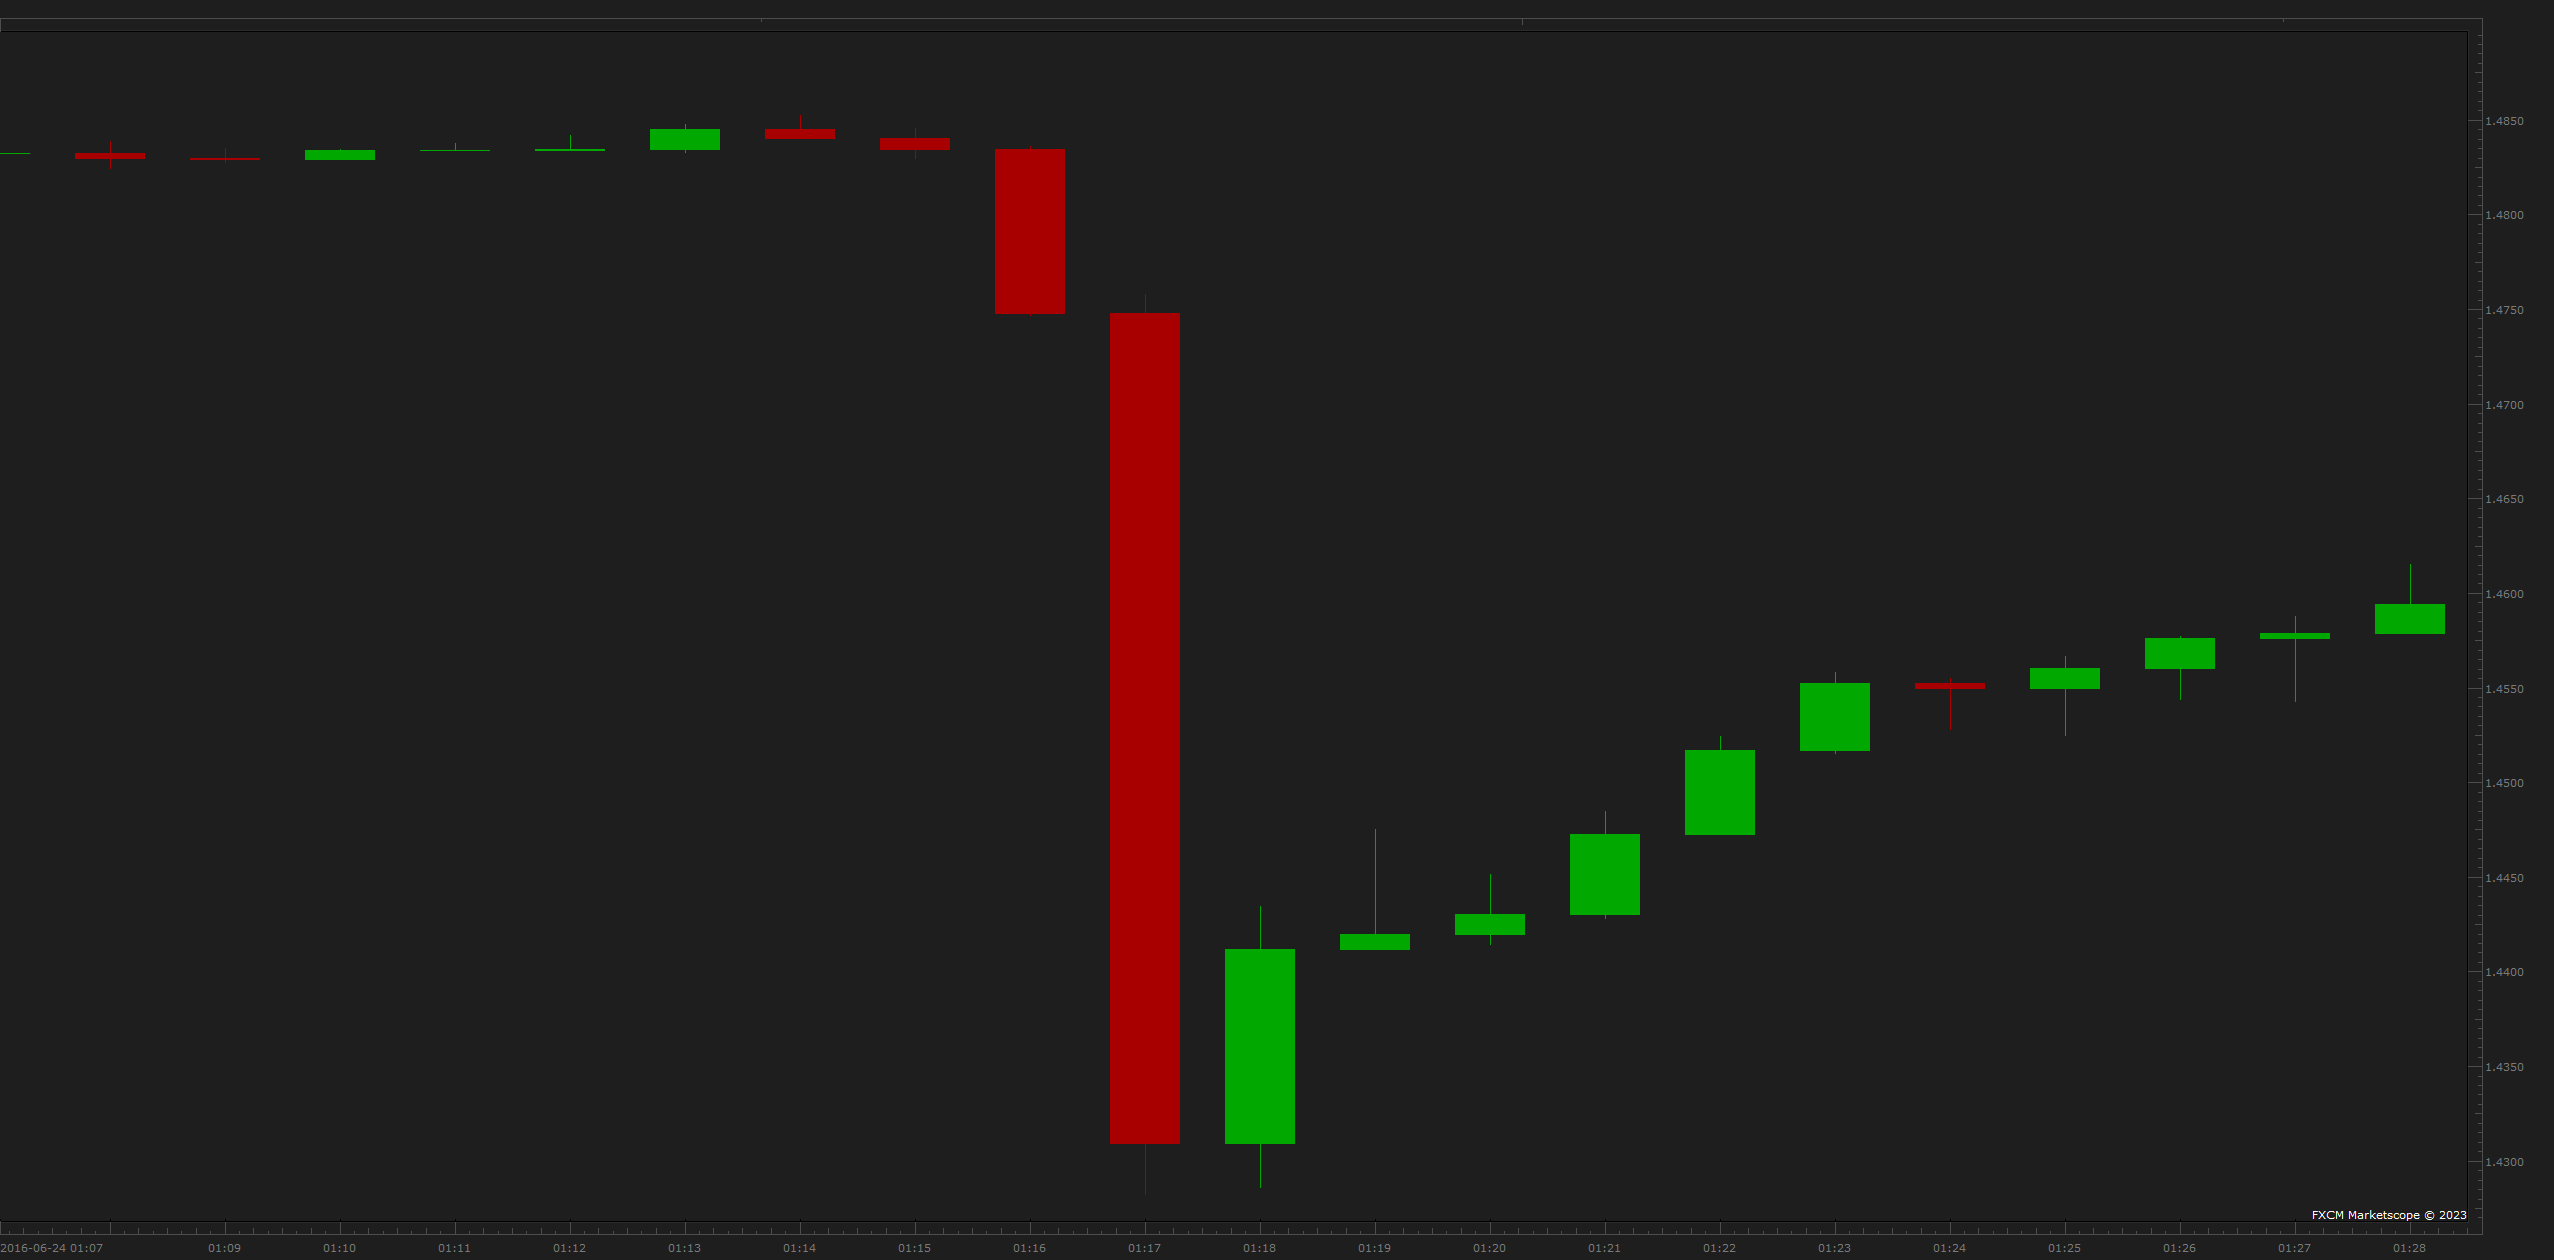
Comparison 1 Minute chart of the first drop
Note, this is a ~20 minute range - I was not able to zoom closer, to match the tick data.
Check the time axis.
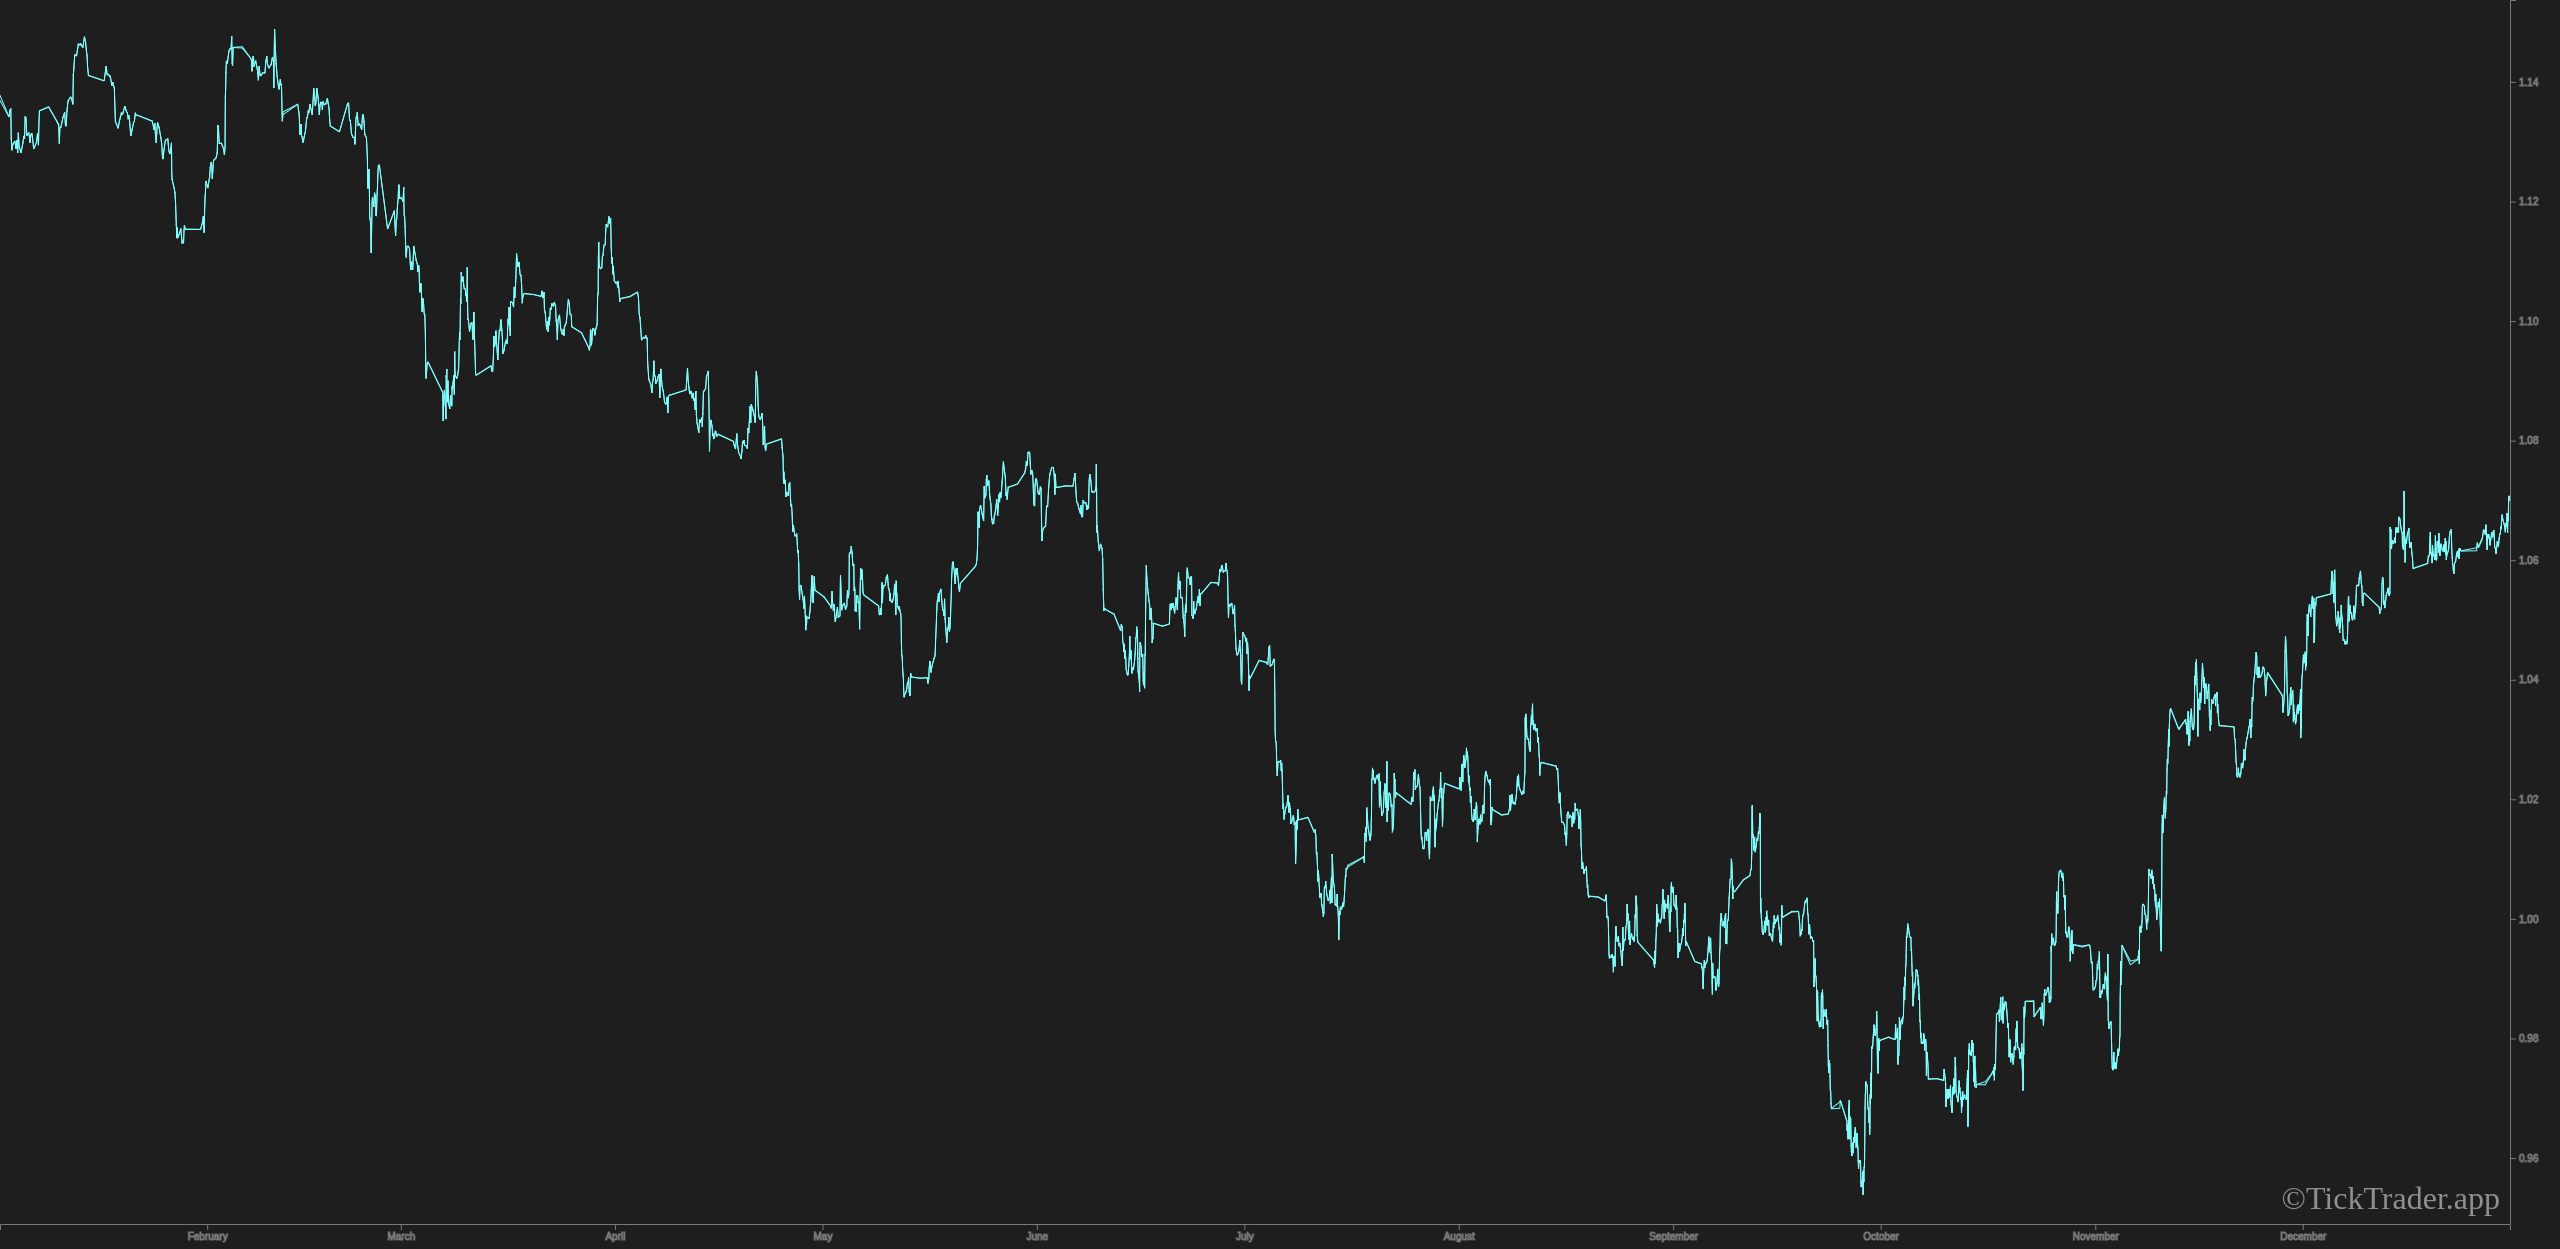
EUR/USD full year 2022
As a scalper, it doesn’t really make sense to view that much data. But it is still possible.
(Note: During weekends there is no price change, this will result in a longer straight line)
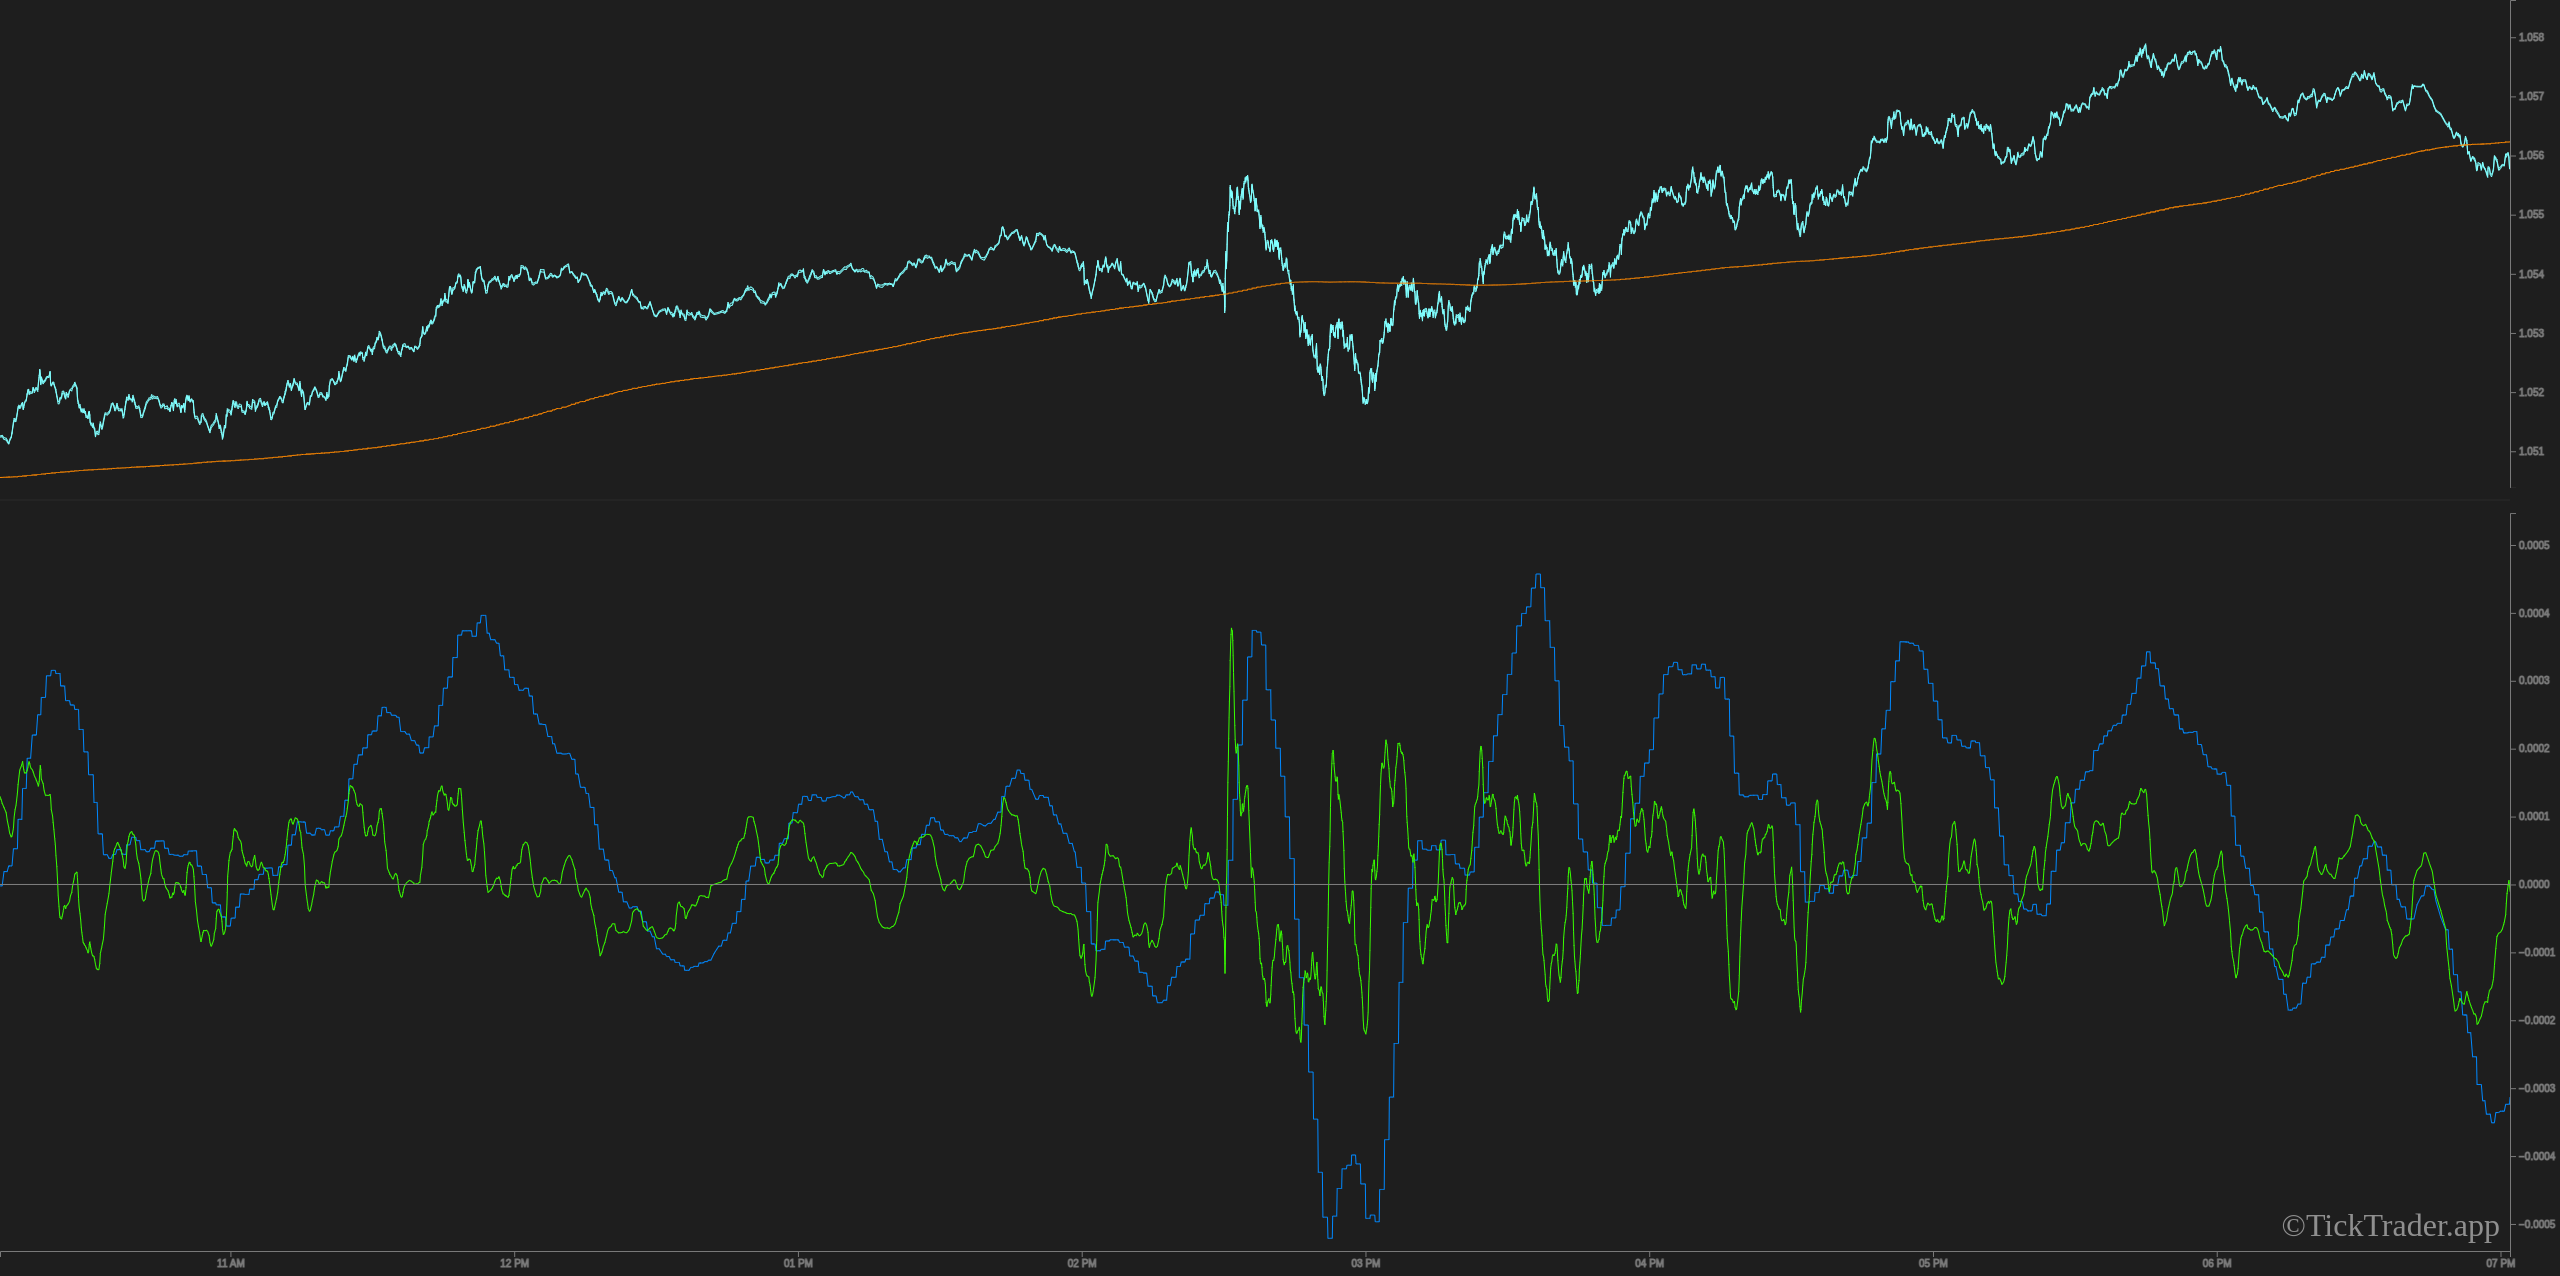
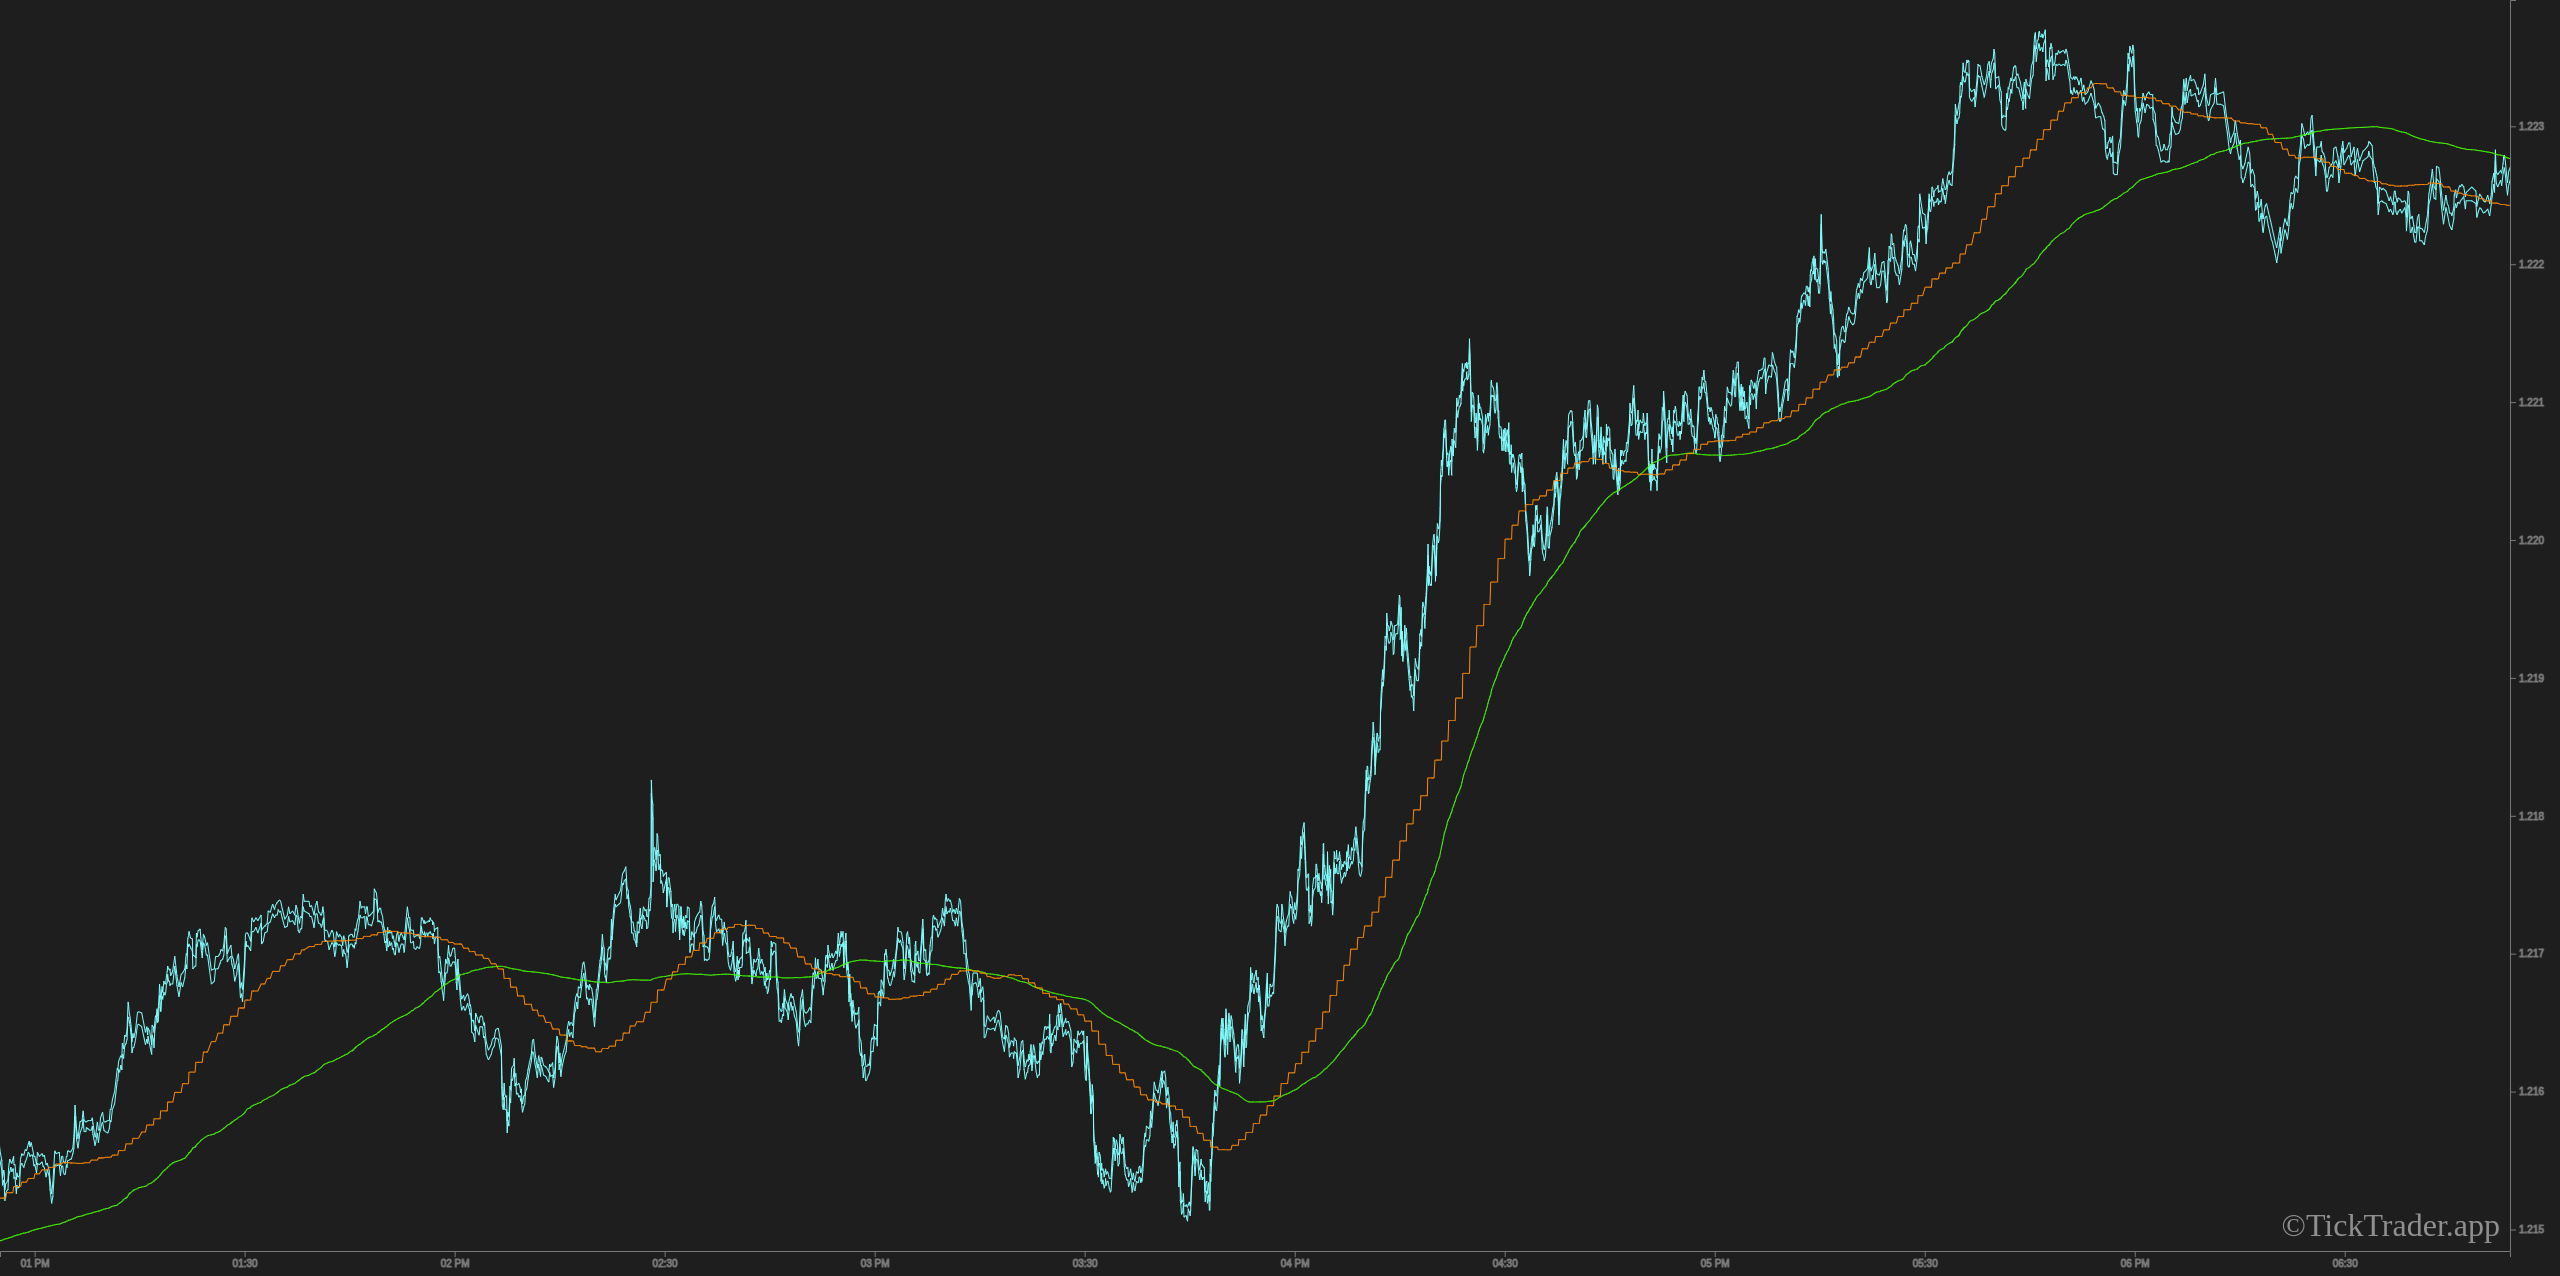
Moving average support (GBPUSD 2023-10-23)
Green: Tick based: 2000
Orange: 1 min based: 20
Notice, that the minute based MA is always constant for 1 minute, unlike to tick based.
Oscillator support (EURUSD 2023-09-28)
Orange: Tick based: 2000
Green: Tick based: 260 / 120
Blue: 1 min based: 26 / 12
